
The structure that you built and minimized represents one possible conformer of a molecule. Some molecules, such as ethane, methanol, or phenol have only one unique conformer. In such situations, the observed chemical properties of the molecule can be obtained by considering the structure of this one conformer. The thermodynamic properties could be obtained by considering structure fluctuations (e.g. bond vibrations) near the minimum energy geometry. The spectral properties of the molecule can be obtained by analyzing how the nuclear or electronic structure changes near this energy minimum in response to external electromagnetic fields. The biological properties can be predicted by considering how the minimum energy structure interacts with biological macromolecules. Thus, in all such cases the observed properties of the molecule can be rationalized by studying the minimum energy structure.
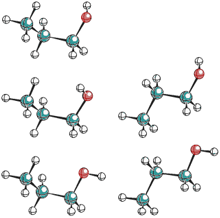
Most molecules exist as a mixture of several conformers. For example, butane and ethanol have two different energy minima (anti and gauche) while 1-propanol has five energy minima that are quite close in relative energies. In such situations, the observed properties of a molecule cannot be obtained by considering only one of the conformers.
 It is likely that some conformers are more reactive than others, either because the reactive groups in these structures are not buried, or because some stereoelectronic effects alter the reactivity. Similarly, the spectrum of a molecule that has several low-energy conformers shows a contribution from each conformer. If the spectroscopy is intrinsically fast relative to the interconversion of conformers (e.g. IR absorption) then the observed spectrum is a weighed sum of the conformer spectra. However, if the spectroscopy is intrinsically slow relative to the interconversion of conformers (e.g. NMR chemical shifts at higher temperatures) then the observed spectrum is weighted average of the conformer spectra. The biological activity of molecules is strongly dependent on their conformation and it is believed that in most cases, the activity is determined by a single "biologically active conformer". For example, enzymes are active only when properly folded into "native state", denaturation into a different conformation (e.g. random coil) leads to the loss of biological activity.
In order to find all the other conformers of the molecule, one can try to draw the molecule in different shapes, and minimize each shape. However, this is tedious and error-prone process because for larger molecules we cannot easily guess the shape of all the possible conformations. Conformational analysis automates this task by finding other molecular structures that are energy minima on the potential energy surface and ranks them according to their energies. The structures that have the lowest energy are most abundant. However, protein-bound ligands often adopt structures that differ substantially from their free structures.
This tutorial illustrates how to perform conformational analysis with the program Macromodel from , which is integrated with Maestro. You will be generating conformers of ethanol molecule. Follow these steps to perform and analyze results of conformational analysis:
The results of calculations have become part of the current project and can be analyzed by selecting Show Table from the Project menu. The Project Table contains two rows, corresponding to the anti and gauche conformers of ethanol. You can use check marks in the second column to select which structure is displayed. Columns in the table provide results of the conformational search, the most important one being the Relative Potential Energy.
Record the relative energy and the CC-OH dihedral angle for each conformer. You can measure the dihedral angle by selecting Tools -> Measurement, clicking on the Dihedrals tab, and then left-clicking on C,C,O,H atoms in the graphical window to define the torsional angle. The result is displayed in the graphical window. Also, determine the C-O distance and CCO angle for each conformer.
Repeat the analysis with the OPLS-AA force field. Prepare a table where you compare the structures (in terms of one characteristic distance and the H-O-C-C dihedral) and stabilities (in terms of the relative potential energy) of the two conformers as found with these two force fields. Your table should look something like this
                              Force Field                Reference
--------------------------------------------------------------------------
                          MMFF         OPLS2003       Expt.      Calc. QM
--------------------------------------------------------------------------
Distances (Ang)
  R(C-O) in anti           1.420        1.411         1.431      1.424
  R(C-O) in gauche         1.420        1.411         1.427      1.422
Angles (Deg)
  CCO in anti                                         107.8°     107.3°
  CCO in gauche                                       112.3°     112.5°
Dihedrals (Deg)
  HO-CC in anti            180°         180°          180°       180°
  HO-CC in gauche          59.9°        65.2°         54 ± 6°    60.0°
Rel. Energies (kJ/mol)
  Gauche vs. anti          0.75         0.61          0.54       0.54
-------------------------------------------------------------------------

*Expt. data from Coussan et al, J Phys Chem A 1998, 102:5789-5793
 and Weibel et al, J Chem Phys 2002 117:4245-4254
After completing this tutorial, perform analogous analysis with one of the molecules that was assigned for your homework using the MMFF and OPLS2003 force fields. Characterize each conformer (for larger systems, use five of the lowest energy conformers). Prepare a table where you compare the structures (in terms of some characteristic distances and the important dihedrals) and stabilities (in terms of the relative potential energy) as found with these two force fields. Briefly discuss similarities and differences between MMFF and OPLS-AA results. Perform a brief literature survey to find out if the relative energies of the conformers of your molecule have been determined experimentally or by reliable quantum mechanical methods; if yes assess the accuracy of the two force fields.