

DNA microarrays are devices that allow quantitative, high-throughput analysis of gene expression in individual cells, tissues, or organs. DNA microarrays generate a fluorescent signal that reports on the expression level of each target gene based on the sequence-specific hybridisation between the soluble target oligonucleotides and immobilized probe oligonucleotides.
The target oligonucleotides are usually prepared from the total mRNA from a given tissue or organ. The mRNA is first converted to cDNA, which is then transcribed and labeled with biotin in vitro. The labeled RNA is fragmented into short target oligonucleotides that will be hybridized with immobilized probes on the microarray.
A DNA microarray contains a large number of single stranded DNA oligonucleotides from known genes. Commercial DNA microarrays have very high density and yield enormous amounts of data. For example, Affymetrix Human Genome U133 Set incorporates over 1 million unique oligonucleotide features on two microarrays. These features are believed to cover about 33,000 established and putative human genes. Each sequence is represented by 11 probe pairs. Each pair contains a perfect match cell, and a corresponding mismatch cell; the latter are used to calibrate the readings from perfect match cells. Each probe cell in U133 array takes up a square of 18 microns in length and contains many copies of identical 25-nucleotide long oligonucleotides.
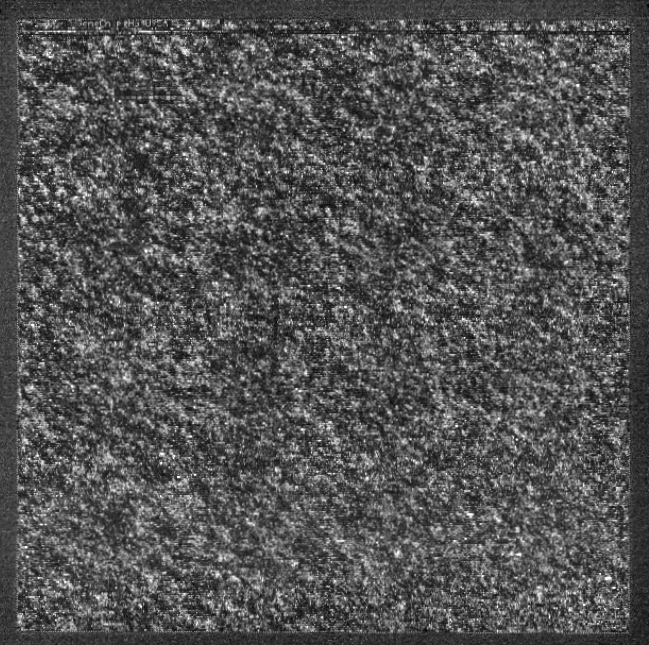
If the tissue sample expresses a particular mRNA, the target sample will contain biotinylated RNA fragments of the same sequence. These target fragments will bind with high affinity to complementary single stranded oligos immobilized on the surface of the gene chip. The target fragments will bind unrelated but homologous sequences, including the probes in the mismatch cell with lower affinity. The extent of binding to the perfect match probe depends on the concentration of the target fragment. The bound target can be visualized by adding a streptavidin-bound fluorescent molecule, such phycoerythrin. Because of the extremely high affinity of streptavidin to biotin, nearly every bound target becomes fluorescent. The raw data from the gene chip is a pixelated image (below) where a group of pixels (e.g. 5 x 5 pixels) corresponds to one probe cell. Thus, one would expect that the intensity of fluorescence from a particular perfect match cell correlates with the amount of bound target, and hence, with the abundance of a particular mRNA in the original sample.
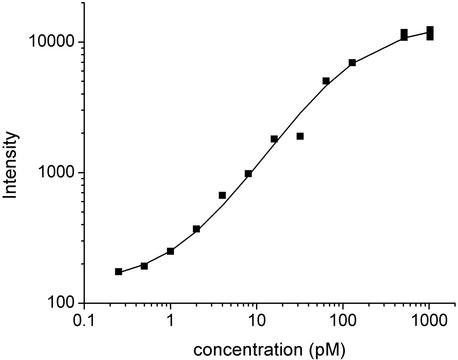 In practice, a good correlation is often observed between the concentration of individual mRNA species and the light intensity if the mRNA concentration is in the range from 1 pM to 1 nM. Too low concentrations give signals that are difficult to distinguish from the background, too high concentrations saturate the system such that the intensity is no longer proportional with the concentration. Figure on the right (from Proc Natl Acad Sci U S A. 2003; 100: 7575-7580) shows a typical correlation between target concentration and fluorescence intensity. However, different sequences can give different signals at the same concentration, and the same intensity can be observed with different concentrations of two different targets. For example, 128 pM sample of AT-rich target would give roughly the same intensity as 16 pM sample of GC-rich target. This sequence-specificity can be partially offset by analyzing multiple fragments from the same gene. Nevertheless, the calculation of absolute concentrations from microarray data without careful calibration is challenging.